Understanding Your Dashboard
The TestParty dashboard provides organizations with a centralized view of their accessibility compliance status, offering real-time insights into website health and remediation progress. Each dashboard is directly linked to a GitHub repository and automatically populates with report data from nightly accessibility scans of your website's sitemap.
Dashboard Components
Project Analysis Section
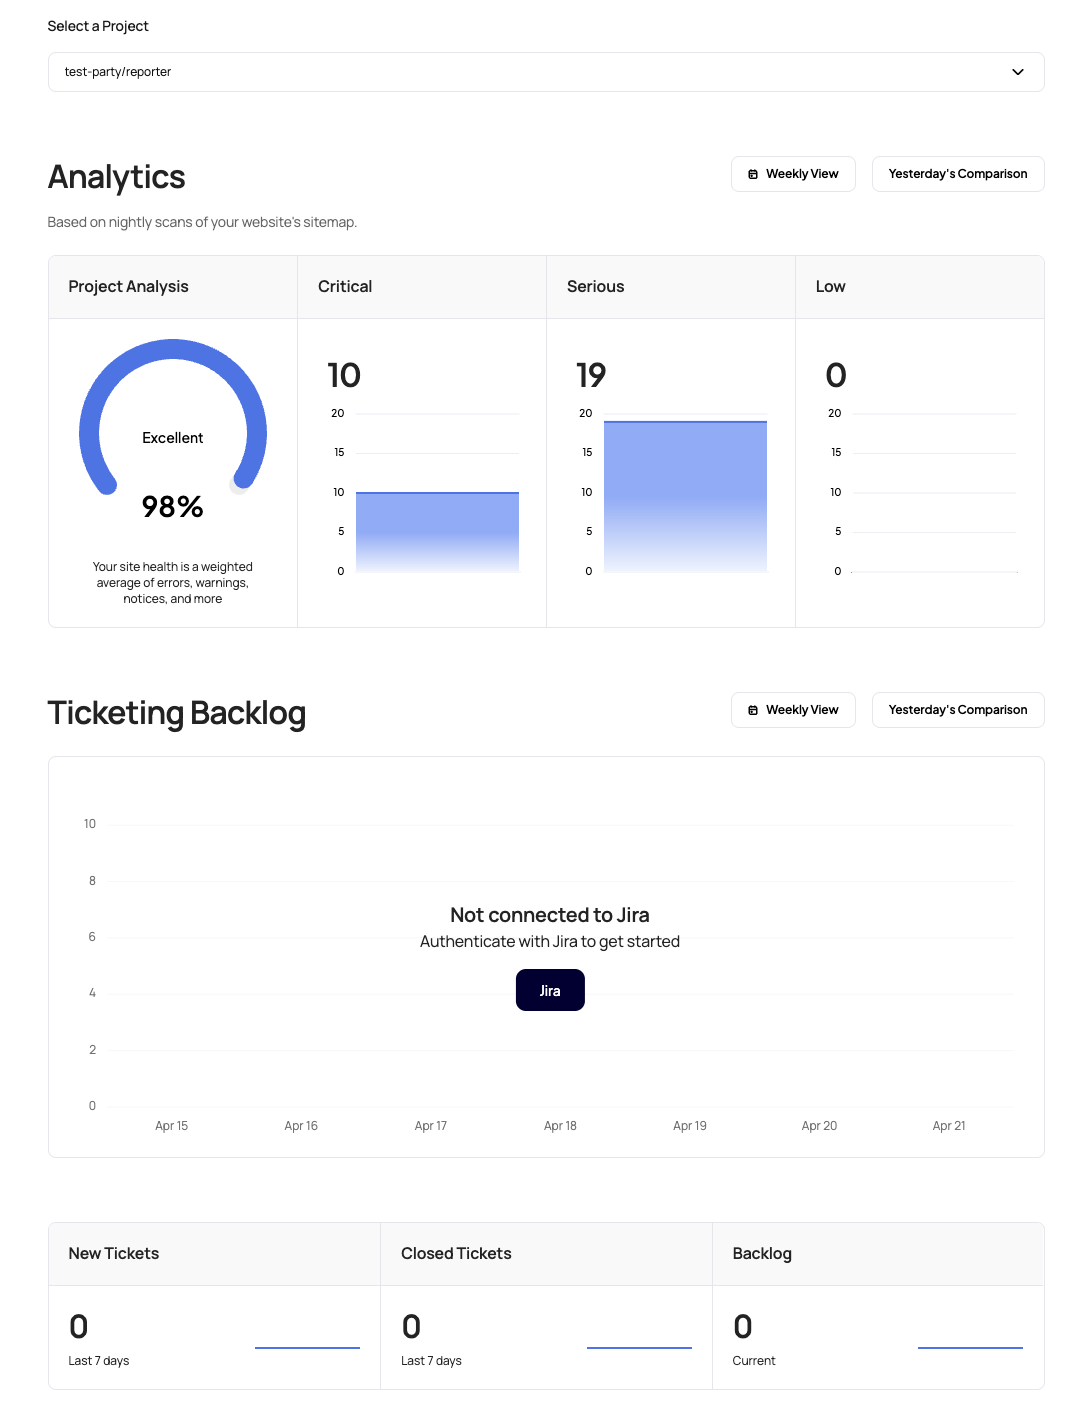
The Project Analysis panel displays your overall site health through a weighted scoring system that combines errors, warnings, notices, and other accessibility metrics.
-
Health Score: A percentage-based rating (shown as 98% in the example) with a visual gauge indicator
-
Status Indicator: Qualitative assessment ranging from "Excellent" to requiring improvement
-
Scoring Methodology: The weighted average accounts for the severity and frequency of different accessibility issues across your site
This centralized score helps stakeholders quickly understand the current state of accessibility compliance and track improvements over time.
Issue Categories
The dashboard categorizes accessibility findings into three severity levels:
Critical Issues
-
High-priority violations that significantly impact user experience
-
Immediate attention required for compliance
-
Visual representation through bar charts showing issue volume over time
Serious Issues
-
Moderate-impact accessibility barriers affecting usability
-
Important to address but not blocking critical user flows
-
Trend visualization to track remediation progress
Low Priority Issues
-
Minor accessibility improvements and best practice recommendations
-
Enhancement opportunities that improve overall user experience
-
Helps teams prioritize maintenance and optimization efforts
Ticketing Integration
The Ticketing Backlog section seamlessly connects accessibility findings with project management workflows:
Jira / Linear Integration
-
Direct authentication with Jira or Linear for automated ticket creation
-
Workflow automation that converts accessibility findings into actionable tickets
-
Bidirectional sync to track remediation progress
Ticket Metrics
-
New Tickets: Recently identified accessibility issues requiring attention
-
Closed Tickets: Resolved issues showing remediation progress
-
Current Backlog: Outstanding accessibility work in the queue
-
Historical Tracking: 7-day trend analysis for workload management
Dashboard Customization Options
TestParty dashboards can be tailored to meet specific organizational needs:
ROI Calculations
-
Cost-benefit analysis of accessibility improvements
-
Resource allocation insights for remediation efforts
-
Business case metrics demonstrating compliance value
Timeline Projections
-
Compliance roadmaps showing projected dates for full accessibility conformance
-
Milestone tracking for WCAG 2.1 AA compliance goals
Custom Statistics
-
Department-specific metrics for distributed teams
-
Compliance reporting for executive dashboards
-
Integration metrics showing development workflow impact
Data Source and Updates
-
Automated Scanning: Dashboards populate automatically from nightly accessibility scans
-
Sitemap-Based Coverage: Comprehensive analysis of all discoverable pages
-
Real-Time Updates: Fresh data reflects the current state of your accessibility posture
-
Historical Trending: Track progress and identify patterns over time